Youth Wants to be Digitally Connected
I finally ran the ECAR student survey data using SPSS. A dear friend suggested I use Excel’s pivot tables and charts. I tried and felt more comfortable with SPSS (version 22 now! Wow!). I regret not doing it earlier. Even though I was discouraged against doing it by someone else, I’ve learned to listen to my heart and act on my intuition. There are a few other furious regrets I have about this project. I will keep them close to my heart and shake off things that don’t matter to me. To say I’m driven to start and finish this project well is an understatement.
The ECAR data are “flat” and not exciting. They are single variables (questions) that elicited certain ratings from respondents, producing frequency counts. With SPSS (and also pivot tables), I could investigate bivariate relationships that WP Facet cannot do.
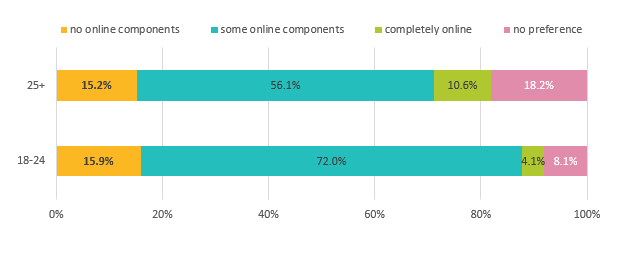
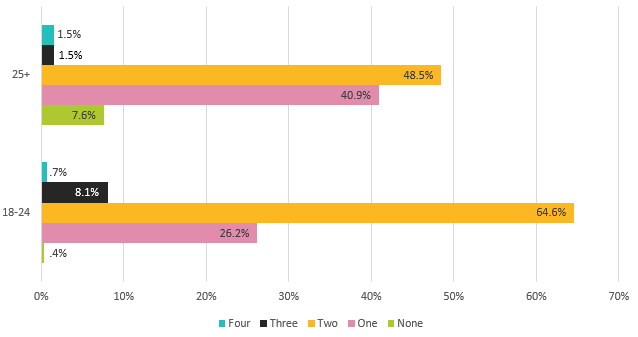
At this preliminary stage, age seems to be the only demographic variable with a correlation to two other variables. My earlier hunch of a metaphor for the findings seem to be fading. Gender and ethnicity produced no statistical significance with any of the major variables I wanted to investigate. I will run more analyses but now, here are the two sets of variables with correlations.
I will present these in a more exciting, creative way in a soon-to-be-constructed story, but this is my blog. I’m glad to be able to write like a boring researcher here. More analysis and inductive reasoning tomorrow.

