-
Awesome Excel Chart Quick Tips for Web Display
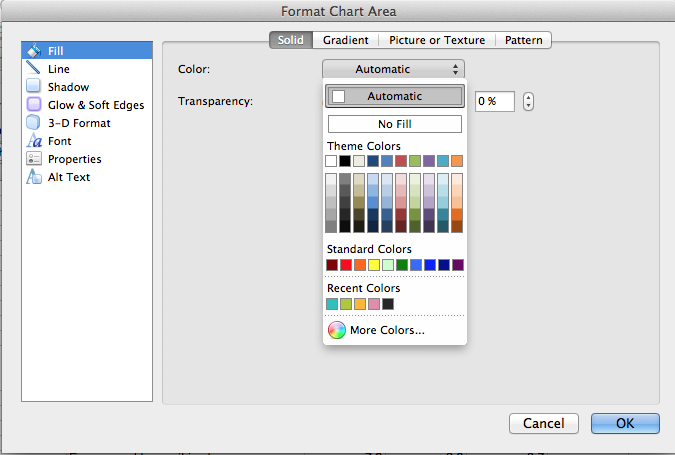
Last week, my colleagues and I created 3 Excel spreadsheets in an effort to highlight some of VCU participants’ responses to the EDUCAUSE ECAR Undergraduate Student and Faculty Technology Research Studies Surveys. This division of labor resulted in an unfortunate consequence. Different machines, different data, and different perspectives resulted in different data presentation styles. To standardize the look of the charts, I offered to be the general editor. One set of eyes working on one machine is likely the best way to make the look and language of the charts…